As active Covid-19 cases cross 1-lakh mark after 122 days, here’s what trend shows

Covid-19 cases have been on the rise again in India, with the country recording over 18,000 cases after a gap of 130 days, taking the cumulative tally to 4,34,52,164, according to data put out by the Union Health Ministry on Thursday. Cases have increased by 78 per cent from the average two weeks ago and deaths, too, have gone up by 119 per cent.
Active cases in the country also crossed the one-lakh mark on Thursday after a gap of 122 days. A total of 18,819 new Covid cases were reported in a span of 24 hours while the death toll climbed to 5,25,116 with 39 new fatalities. The active cases, as such, went up to 1,04,555 comprising 0.24 per cent of the total infections, while the recovery rate stood at 98.55 per cent.
An increase of 4,953 cases has been recorded in the active Covid-19 caseload in a span of 24 hours. The daily positivity rate was recorded at 4.16 per cent and the weekly positivity rate at 3.72 per cent, according to the ministry.
Where are Covid cases rising again?
According to the data published by the Health Ministry, there are 43 districts around the country that are recording a weekly positivity rate of 10 per cent or more. Kerala tops this list with 11 districts, followed by Mizoram (6) and Maharashtra (5).
Among the districts, Mizoram’s Kolasib tops the list, recording a positivity rate of 64.86 per cent. However, what is to be kept in mind is that the state does not perform too many Covid-19 tests when compared to others. The positivity rate is the proportion of samples tested that return positive.
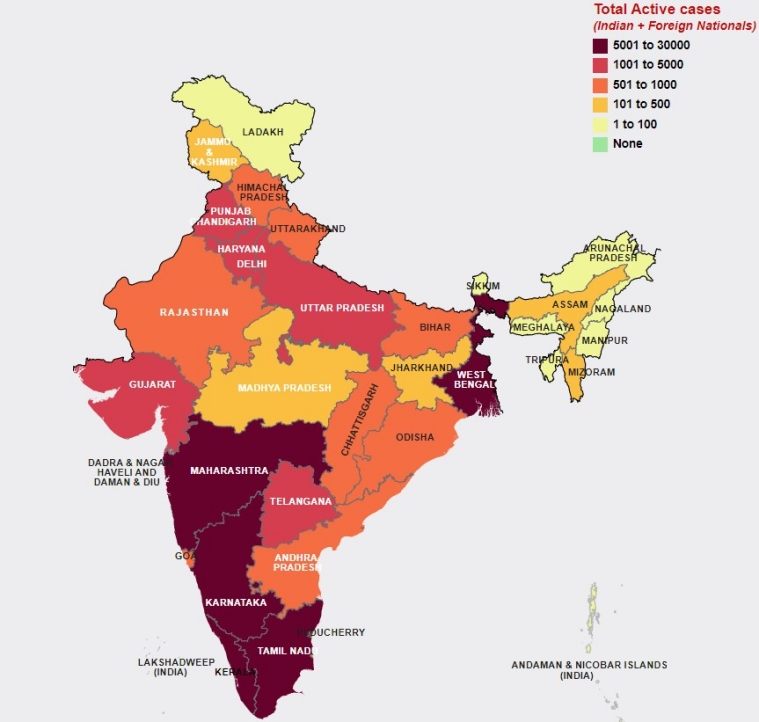
 The map shows the number of active cases across the country. (Map courtesy: MapMyIndia)
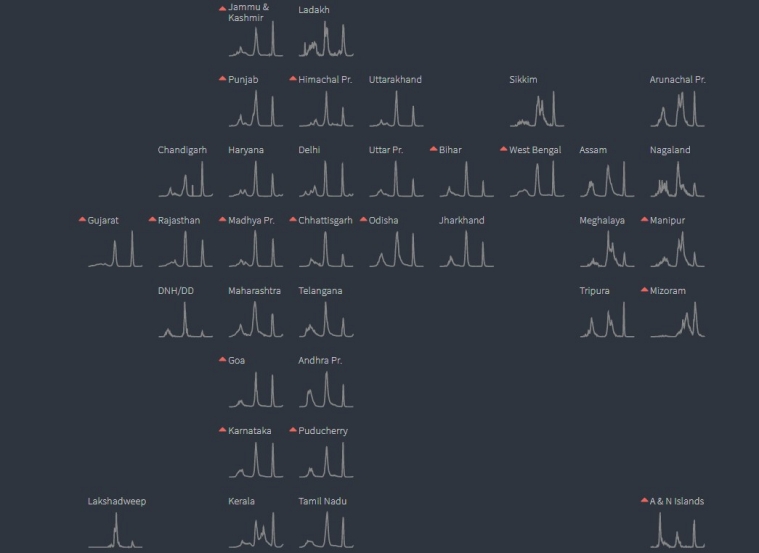
The other states that have been witnessing a noticeable rise include Jammu and Kashmir, Punjab, Himachal Pradesh, Bihar, West Bengal, Gujarat, Rajasthan, Madhya Pradesh, Chhattisgarh, Odisha, Manipur, Mizoram, Goa, Karnataka and Puducherry. While there are 42 districts in India that are recording a positivity rate between 5 and 10 per cent, the 627 others are still below the 5 per cent-mark.
According to the trend this month, the country crossed the 4,000-mark on June 3, 7,000-mark on June 9, 8,000-mark on June 11, 12,000-mark on June 16, 13,000-mark on June 18, 17,000-mark on June 24 and 18,000-mark on June 30.
India’s Covid-19 tally had crossed the 20-lakh mark on August 7, 2020, 30 lakh on August 23, 40 lakh on September 5 and 50 lakh on September 16. It went past 60 lakh on September 28, 70 lakh on October 11, crossed 80 lakh on October 29, 90 lakh on November 20 and surpassed the one-crore mark on December 19. The country crossed the grim milestone of two crore on May 4 and three crore on June 23 last year. It crossed 4 crore on January 25 this year.
 The chart shows states recording an average rise in infections over the last 2 weeks. (Data courtesy: Reuters)
What about deaths?
The 39 new fatalities recorded on Thursday include 17 from Kerala, 7 from Maharashtra, 4 from Uttar Pradesh, 3 from Punjab, 2 each from Haryana, Karnataka and West Bengal and 1 each from Delhi and Sikkim.
Of the total deaths recorded to date, 1,47,922 are from Maharashtra, 69,993 from Kerala, 40,117 from Karnataka, 38,026 from Tamil Nadu, 26,261 from Delhi, 23,538 from Uttar Pradesh and 21,218 from West Bengal. To put it into perspective, at least 1 in 2,602 Indians have died from the novel coronavirus, taking the cumulative toll to 5,25,116.
The Health Ministry, however, stressed that more than 70 per cent of the deaths occurred due to comorbidities.
What does the trend show?
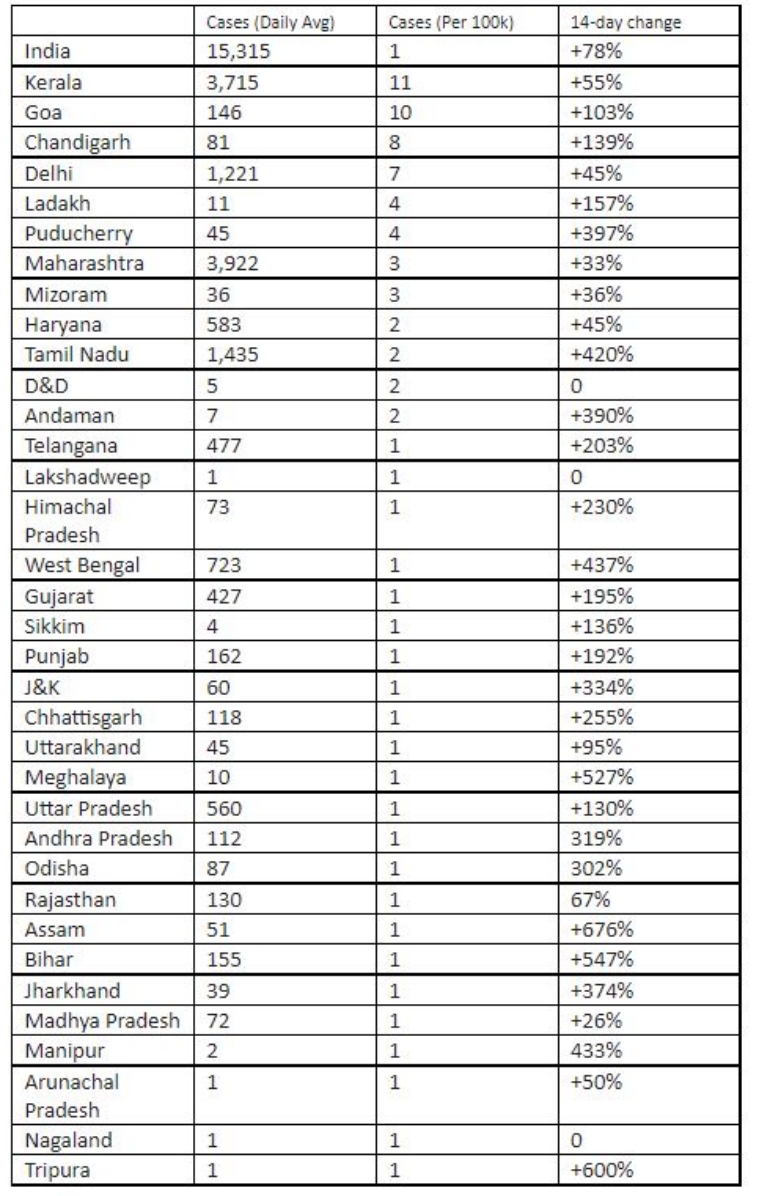
Since the beginning of the pandemic, at least 1 in 31 residents have been infected with Covid-19 in India. An average of 15,315 cases per day were reported in India in the last week with new infections increasing by 78 per cent from the average two weeks ago and deaths by 119 per cent.
 The above chart shows Covid-19 cases in states per 100,000 residents in the last seven days.

